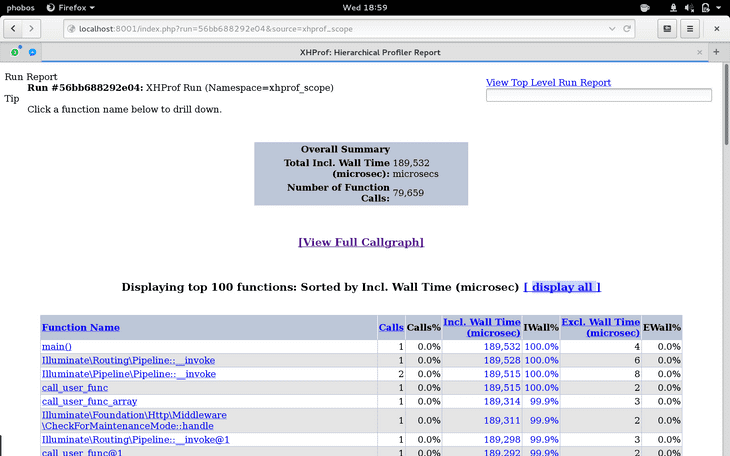
I’ve recently been dealing with slow endpoints on a PHP application written using Laravel. Normally, I would use XDebug, which is the go-to PHP debugging tool, capture performance information of the affected code paths, and load the results into a tool like PHPStorm, which has a built-in UI for analyzing the captures. This seemed a bit tedious to me due to having to manually open each file, so I decided to go and look for other options, and that led me to XHProf, which is a tool specific for profiling built by Facebook. It looked promising so I decided to give it a try.
Like XDebug, XHProf needs its own extension to work. Luckily, the extension is built-in on HHVM, so I didn’t had to compile anything (well, besides HHVM itself) to get started.
After capturing a couple of runs, I was able to identify the bottlenecks on the endpoints, thanks to the callgraphs, which are rendered by the XHProf UI and point out in red the functions that consumed most of the time during the request or session.
The UI is not very visually appealing, but it definitely gets the job done. I was able to quickly lookup runs which definitely takes less time than loading individual XDebug captures into PHPStorm.
Additionally, being able to enable the profiling programatically reduces the amount of noise when you want to focus on a specific section of your code.
Below, I include a quick How-To on using XHProf within Laravel applications:
Getting started
Install the XHProf package using Composer:
NOTE: There are many XHProf packages out there. Some are maintained, others are abandoned. The most up-to-date seems to be
phacility/xhprof, however it does not include acomposer.jsonfile.lox/xhprofis a fork of that same repository, but it also includes acomposer.jsonfile.
composer require lox/xhprofThen add a middleware class to your project that enables profiling while a request is being handled. Its also possible to enable XHProf earlier in the application lifecycle, if you are interested in profiling the framework booting process.
Here’s an example of said middleware:
namespace App\Http\Middleware;

use Closure;
use Illuminate\Http\Request;
use XHProfRuns_Default;

/**
 * Class XhprofMiddleware.
 *
 * XHProf is a useful profiling tool built by Facebook. This middleware allows
 * developers to profile specific requests by appending `xhprof=true` to any
 * query.
 *
 * Results will be stored on `/tmp` and can be visualized using the XHProf UI.
 *
 * @author Eduardo Trujillo <ed@chromabits.com>
 * @package App\Http\Middleware
 */
class XhprofMiddleware
{
    /**
     * Handle an incoming request.
     *
     * @param Request $request
     * @param Closure $next
     *
     * @return mixed
     */
    public function handle($request, Closure $next)
    {
        // We will only profile requests if the proper flag is set on the query
        // of the request. You may further customize this to be disabled on
        // production releases of your application.
        if ($request->query->get('xhprof') !== 'true') {
            return $next($request);
        }

        xhprof_enable();

        $result = $next($request);

        $xhprofData = xhprof_disable();
        $xhprofRuns = new XHProfRuns_Default('/tmp');

        $runId = $xhprofRuns->save_run($xhprofData, 'xhprof_laravel');

        // We will attach the XHProf run ID as part of the response header.
        // This is a lot better than modifying the actual response body.
        $result->headers->set('X-Xhprof-Run-Id', $runId);

        return $result;
    }
}
Then, load the middleware into the application by adding it to your
Kernel.php file.
Capturing runs and visualizing
The middleware above is setup to enable profiling whenever xhprof=true is
set on the request query. This means that setting this flag on any request to
your application should trigger profiing for that request.
All runs will be stored on /tmp by default. To help with looking up results,
the middleware will also add a HTTP header to the response with the ID of the
run.
Results can be inspected by hand, however it is generally more useful to use the built-in “UI” which is capable of generating callgraphs and showing the timing of all functions called.
With HHVM, a web server for the UI can be launched from the root of a project:
hhvm -m server -d hhvm.server.type=proxygen \
 -d hhvm.server.source_root=$(pwd)/vendor/lox/xhprof/xhprof_html \
 -d hhvm.server.port=8001 \
 -d hhvm.server.default_document=index.php